Wilmar is likely to break the mid term uptrend support on 13 Jan 09, with Crude Oil down US$2.60 at the time of post. - US$38.
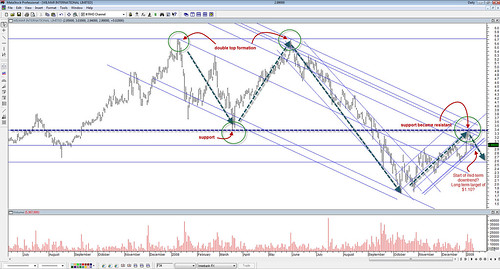
Wilmar formed a double top at $5.72.
Take it as $5.70.
It hit the support of $3.40 on 18 Mar 2008.
Between 5 - 7 Jan 2009, it hit around $3.40 and turned down.
$5.70 - $3.40 = $2.30.
If this counter is going to do a mirror image of the top, $3.40 being the reflective axis, $3.40 - $2.30, are we going to see price objective of $1.10 in the long term?:D
Let's see.
No comments:
Post a Comment